Dataset : Emissions Dataset
Description: In the United States, the Environmental Protection Agency (EPA) is tasked with setting national ambient air quality standards for fine PM and for tracking the emissions of this pollutant into the atmosphere. Approximatly every 3 years, the EPA releases its database on emissions of PM2.5. For each year and for each type of PM source, the NEI records how many tons of PM2.5 were emitted from that source over the course of the entire year. The data that you will use for this assignment are for 1999, 2002, 2005, and 2008. The overall goal is to explore the National Emissions Inventory database and see what it say about fine particulate matter pollution in the United states over the 10-year period
1999–2008.
Key Results:
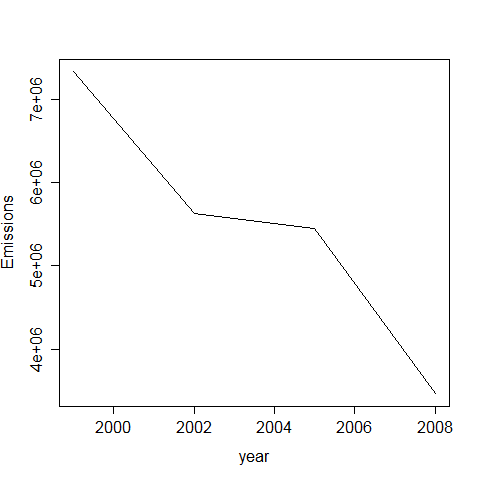
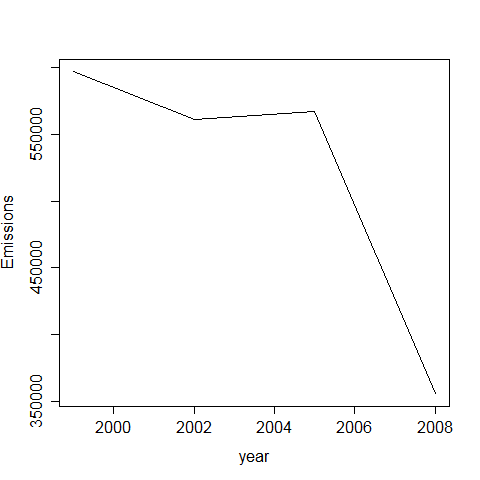
Plot 1: Total emissions from PM2.5 in the United States from 1999 to 2008
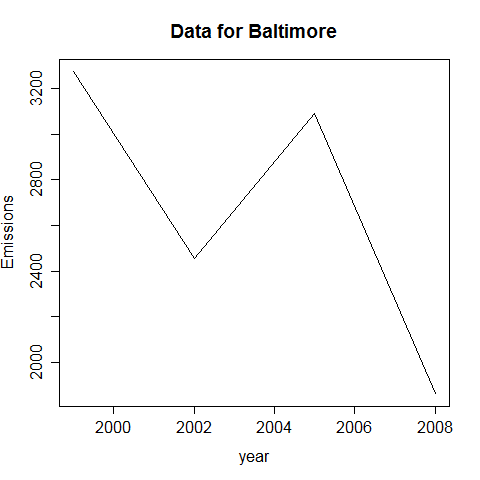
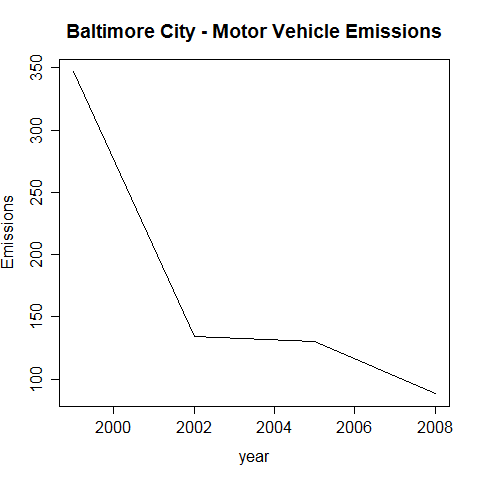
Plot 2: Total emissions from PM2.5 in the Baltimore City, Maryland (fips == “24510”) from 1999 to 2008
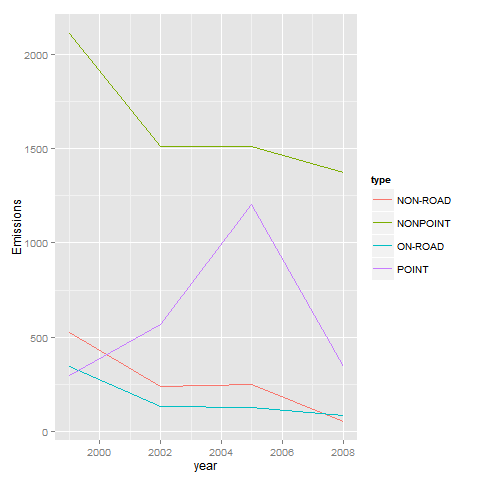
Plot 3: Sources indicated by the type (point, nonpoint, onroad, nonroad) variable, which of these four sources have seen decreases in emissions from 1999–2008 for Baltimore City
Plot 4: Across the United States, Changes in emissions from coal combustion-related sources from 1999–2008
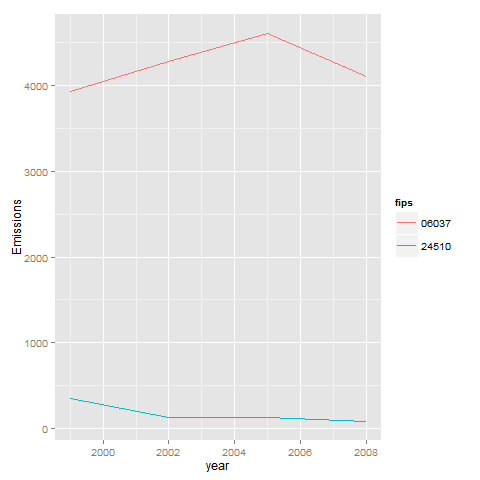
Plot 5: Changes in emissions from motor vehicle sources from 1999–2008 in Baltimore City
Plot 6: Comparison in emissions from motor vehicle sources in Baltimore City with emissions from motor vehicle sources in Los Angeles County, California (fips == “06037”)